

Every site, every metric — on one screen
Unify people, process and physical assets into one intuitive monitoring platform — real-time site transparency, shaped 100% to your operations.
A proven Singapore framework, customised to your smart dashboard
The dashboard you see is not IT theory — it is built from 40 years of real HQ operations managing complex building and landscape sites in Singapore. Unlike rigid, off-the-shelf software, every layout widget, SLA threshold metric, and live camera or IoT integration is reshaped around your exact operational SOPs, not the other way round.
Singapore Heritage
40 years
of battle-tested HQ operations managing multi-site facilities, high-rise buildings, and landscape maintenance.
Adaptive by Design
100% customisable
layouts, incident escalation workflows, dynamic KPIs, and device integrations (CCTV/IoT) built directly around your existing ecosystem.
Multi-module intelligence, a single command console
Seamlessly bridge site management, manpower tracking, fleet logistics and financial health. Switch between overall field operations and micro-level site telemetry — each rendered live from a single, unified interface.
Module 01
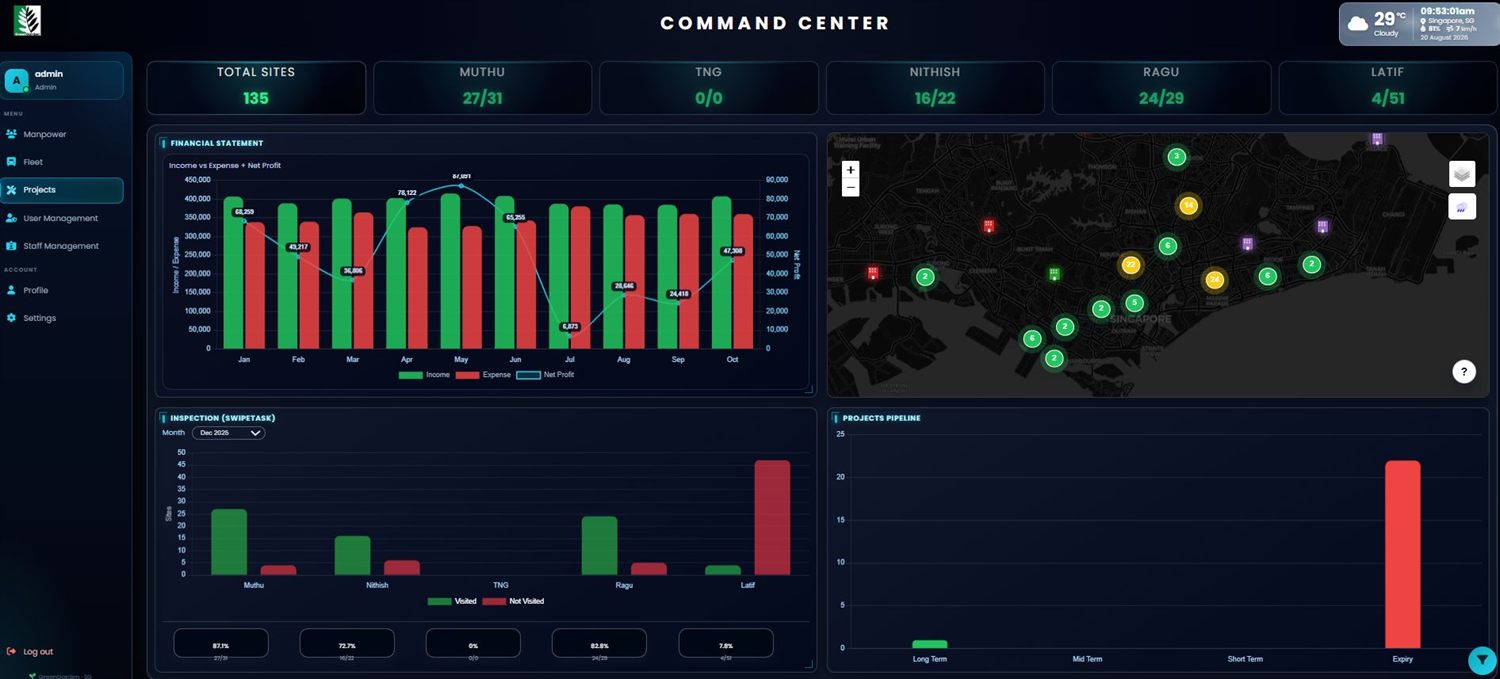
Project & Operations Intelligence
- 01
Total sites & executive workload
Active sites monitored live — track total active property portfolios with per-supervisor workload distribution at a glance.
- 02
Inspection & Swipetask analytics
Visited versus not-visited status — real-time site audit tracking filtered by month, flagging unvisited locations to eliminate service blind spots.
- 03
GIS & spatial location intelligence
Dynamic regional site map — every active project plotted with real-time status markers and supervisor geo-location tracking.
- 04
Real-time financial statement & profitability
Live income versus expense versus net profit — an integrated operational chart keeping project margins healthy month over month.
- 05
Contracts & project pipeline lifecycle
Contract expiry & risk flagging — classifies long, mid and short-term contracts, automatically flagging upcoming expiries for renewal.
Module 02
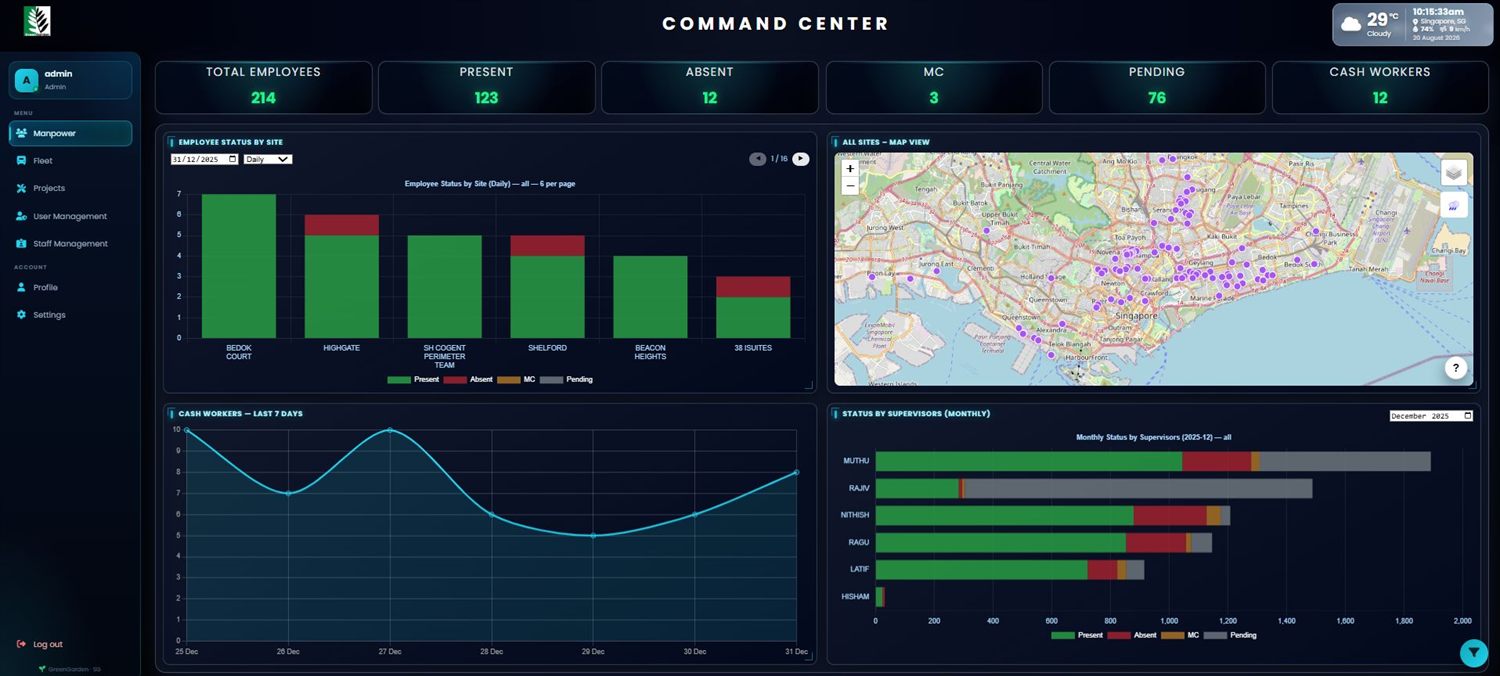
Real-Time Manpower & Field Tracking
- 01
Live GPS & spatial workforce mapping
Every active field worker and supervisor plotted live on an interactive GIS map, for total ground visibility and movement tracking.
- 02
Real-time headcount & attendance matrix
Live headcount breakdown — present, absent, MC and pending — updated dynamically to resolve manpower shortages per site.
- 03
Supervisor-level accountability
A performance scorecard tracking team attendance and task completion grouped by site supervisor, enforcing ground accountability.
- 04
Ad-hoc & cash worker leakage protection
Monitors ad-hoc workforce trends over a seven-day rolling window to prevent unjustified overtime, phantom claims and budget leakage.
Module 03
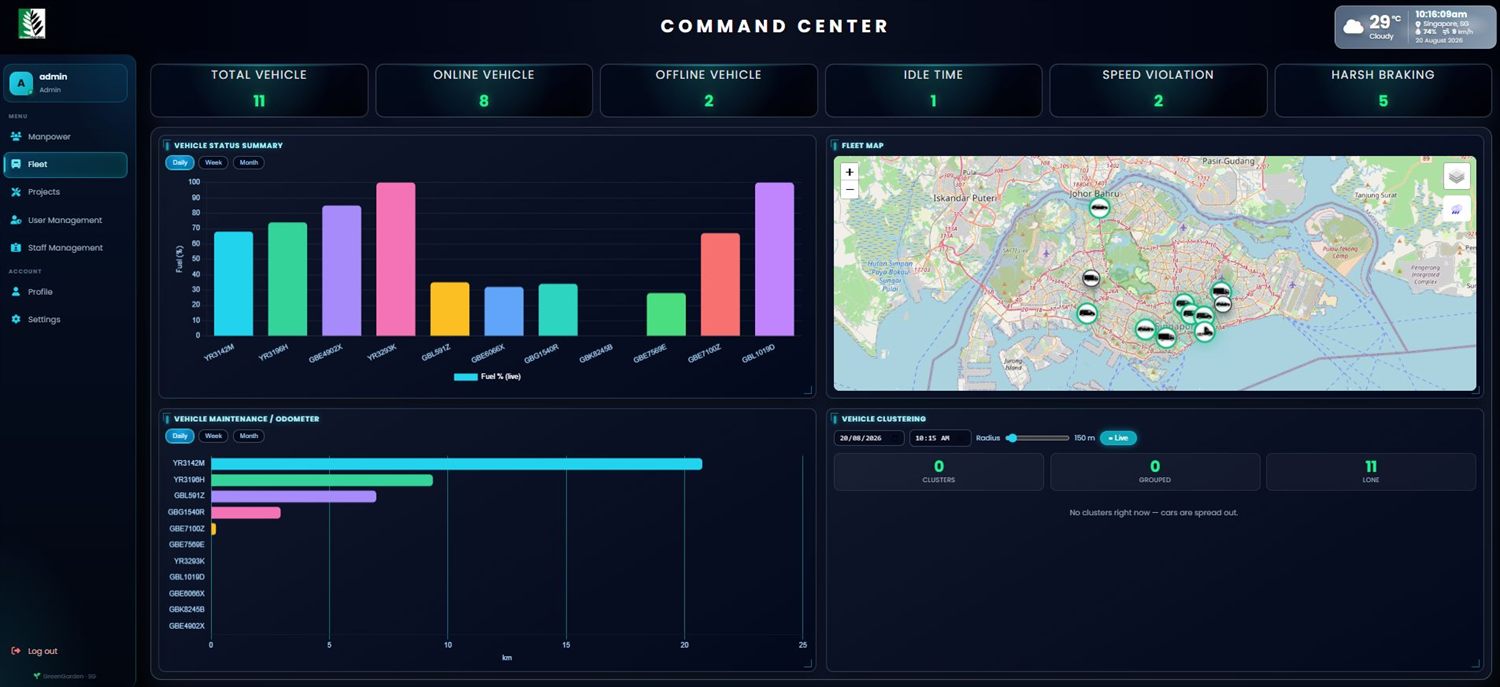
Fleet & Telematics Logistics
- 01
Dynamic vehicle status summary
Real-time metrics for fleet health and fuel capacity across every registered plate, with idle duration, speed violations and harsh braking.
- 02
Predictive maintenance & odometer
Automated mileage tracking tied to maintenance schedules, filterable daily, weekly or monthly to prevent breakdowns.
- 03
Live fleet map & telematics navigation
An interactive GPS map tracking live vehicle locations, online and offline status, and active movement routes across operational zones.
- 04
Intelligent vehicle clustering
Live proximity tracking that detects vehicles grouping inside a customisable radius, flagging unauthorised clustering or idle gatherings.
Module 04
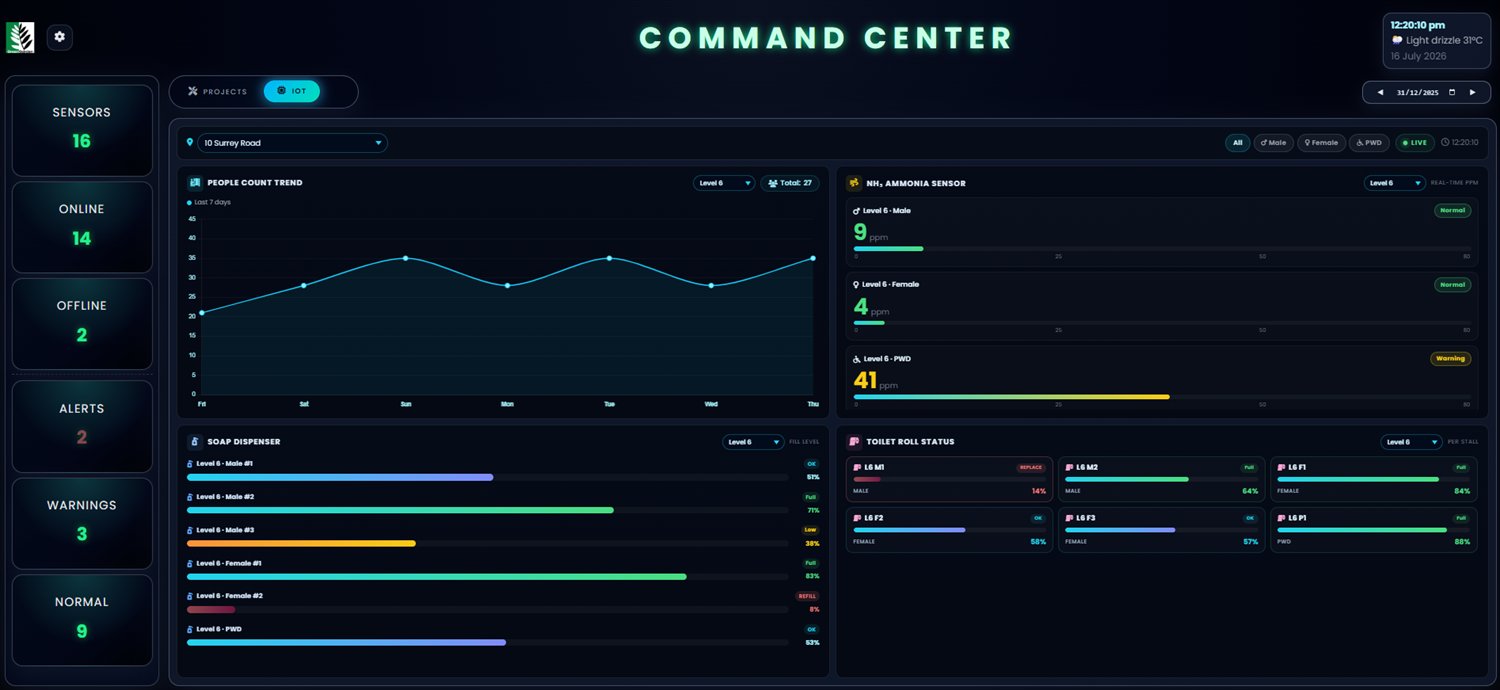
Smart IoT Facilities
- 01
NH₃ ammonia sensor
Odour index per washroom; a high reading triggers an instant clean-up alert.
- 02
Toilet-roll status
Live capacity per stall — turning from green to red the moment it needs replacing.
- 03
Soap dispenser level
Reservoir percentage per dispenser — Full, Low or Refill, before it runs dry.
- 04
People-count trend
Seven-day footfall, so cleaning shifts can be timed to the real peaks.
- 05
Central device status
Sensors, online, offline and alerts — the whole IoT estate on one panel.
Built for industry scale
Flexible enough to integrate with many building architectures and modes of operation.
Property Developers
Smart Cities
Industrial Parks
Universities & Campuses
Healthcare Facilities
Airports & Transport
Ports & Logistics
Government Agencies
Five steps to go live
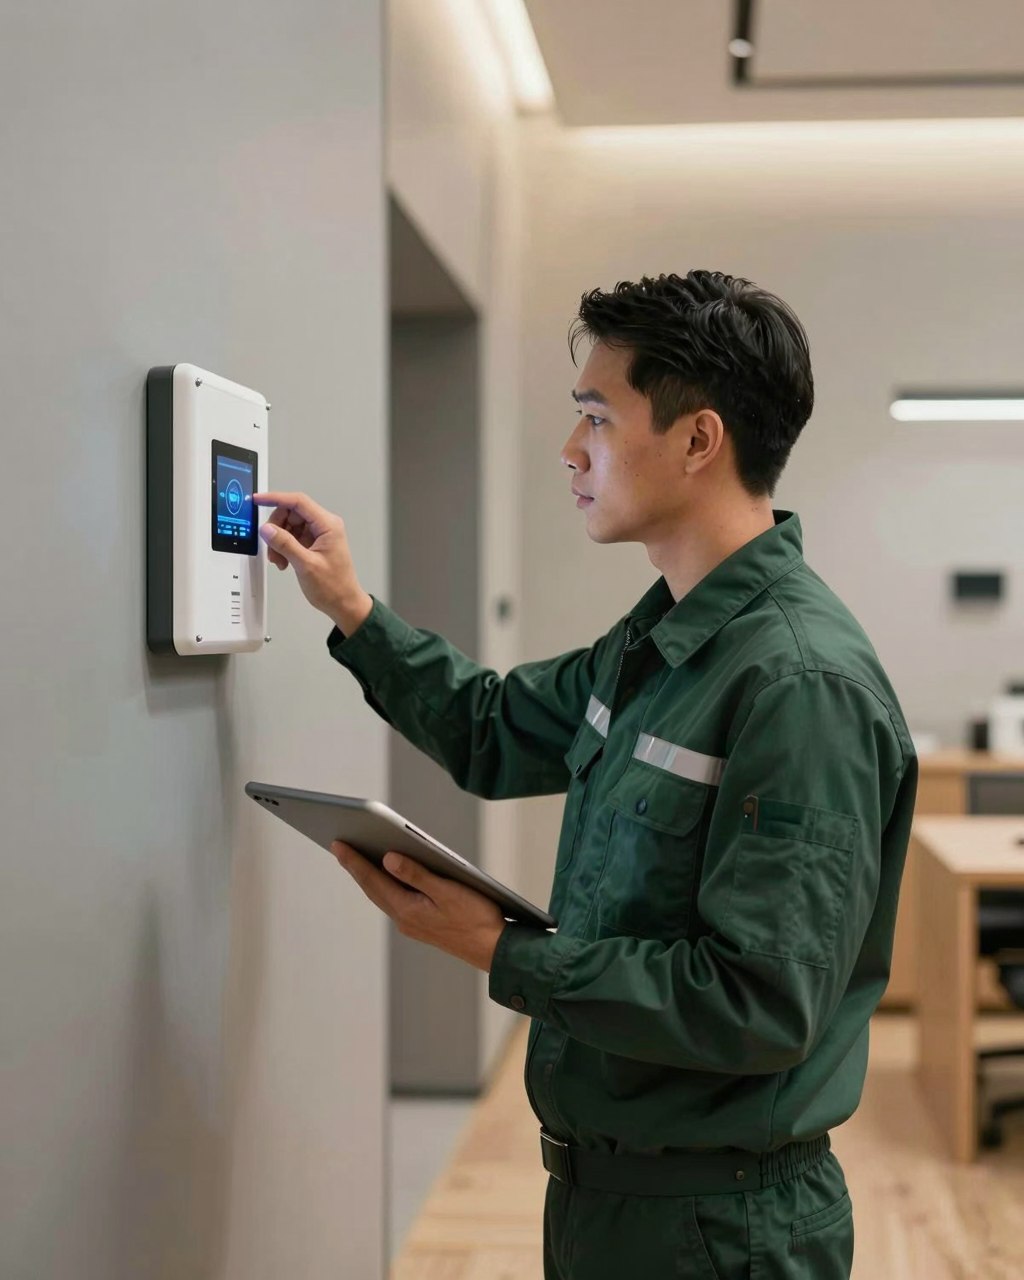
1
Assessment & Discovery
We evaluate site boundaries, active supervisor workflows, existing CCTV/IoT hardware, and fleet tracking needs to establish a complete integration baseline.
2
Solution Design
Customising manpower, fleet and financial module widgets, setting SLA escalation rules, and mapping GIS markers tailored to your organisational structure.
3
System Integration
Connecting face-recognition attendance readers, vehicle GPS telematics, Swipetask mobile apps, and financial data feeds into the central Command Centre.
4
Deployment & Testing (UAT)
Rigorous User Acceptance Testing (UAT) to stress-test live data telemetry, attendance logging accuracy, and instant alert notifications under actual field conditions.
5
Training & Support
Structured onboarding for site supervisors and HQ management teams, supported by ongoing system updates and 24/7 technical helpdesk assistance.
See the dashboard working
Open a fully populated demonstration console and move through the modules yourself. Sample data throughout, every widget live, nothing to install and no sign-in.
Ready to see the Smart Dashboard live?
Share your building specs, operations flows and customisation needs — and we'll map the dashboard to them.